As one of the world’s most critical base chemicals, methanol is used to make a wide range of products, from everyday materials like plastics to fuels and fertilizers. Current production is responsible for 10% of emissions in the (petro)chemical sector or 0.3% of global GHG emissions. However, thanks to its versatility as a shipping and aviation fuel, its decarbonization potential stretches way beyond.
Therefore, the growth of the low-carbon methanol market is twofold: The existing market must decarbonize, and overall demand will grow thanks to new applications. First, we should compare it with other decarbonization alternatives, learn the different use cases, and assess what additional infrastructure is needed. Second, to decarbonize the whole market, we must understand the current pathways, see where further investment is necessary, and determine which technology makes more sense for which environment.
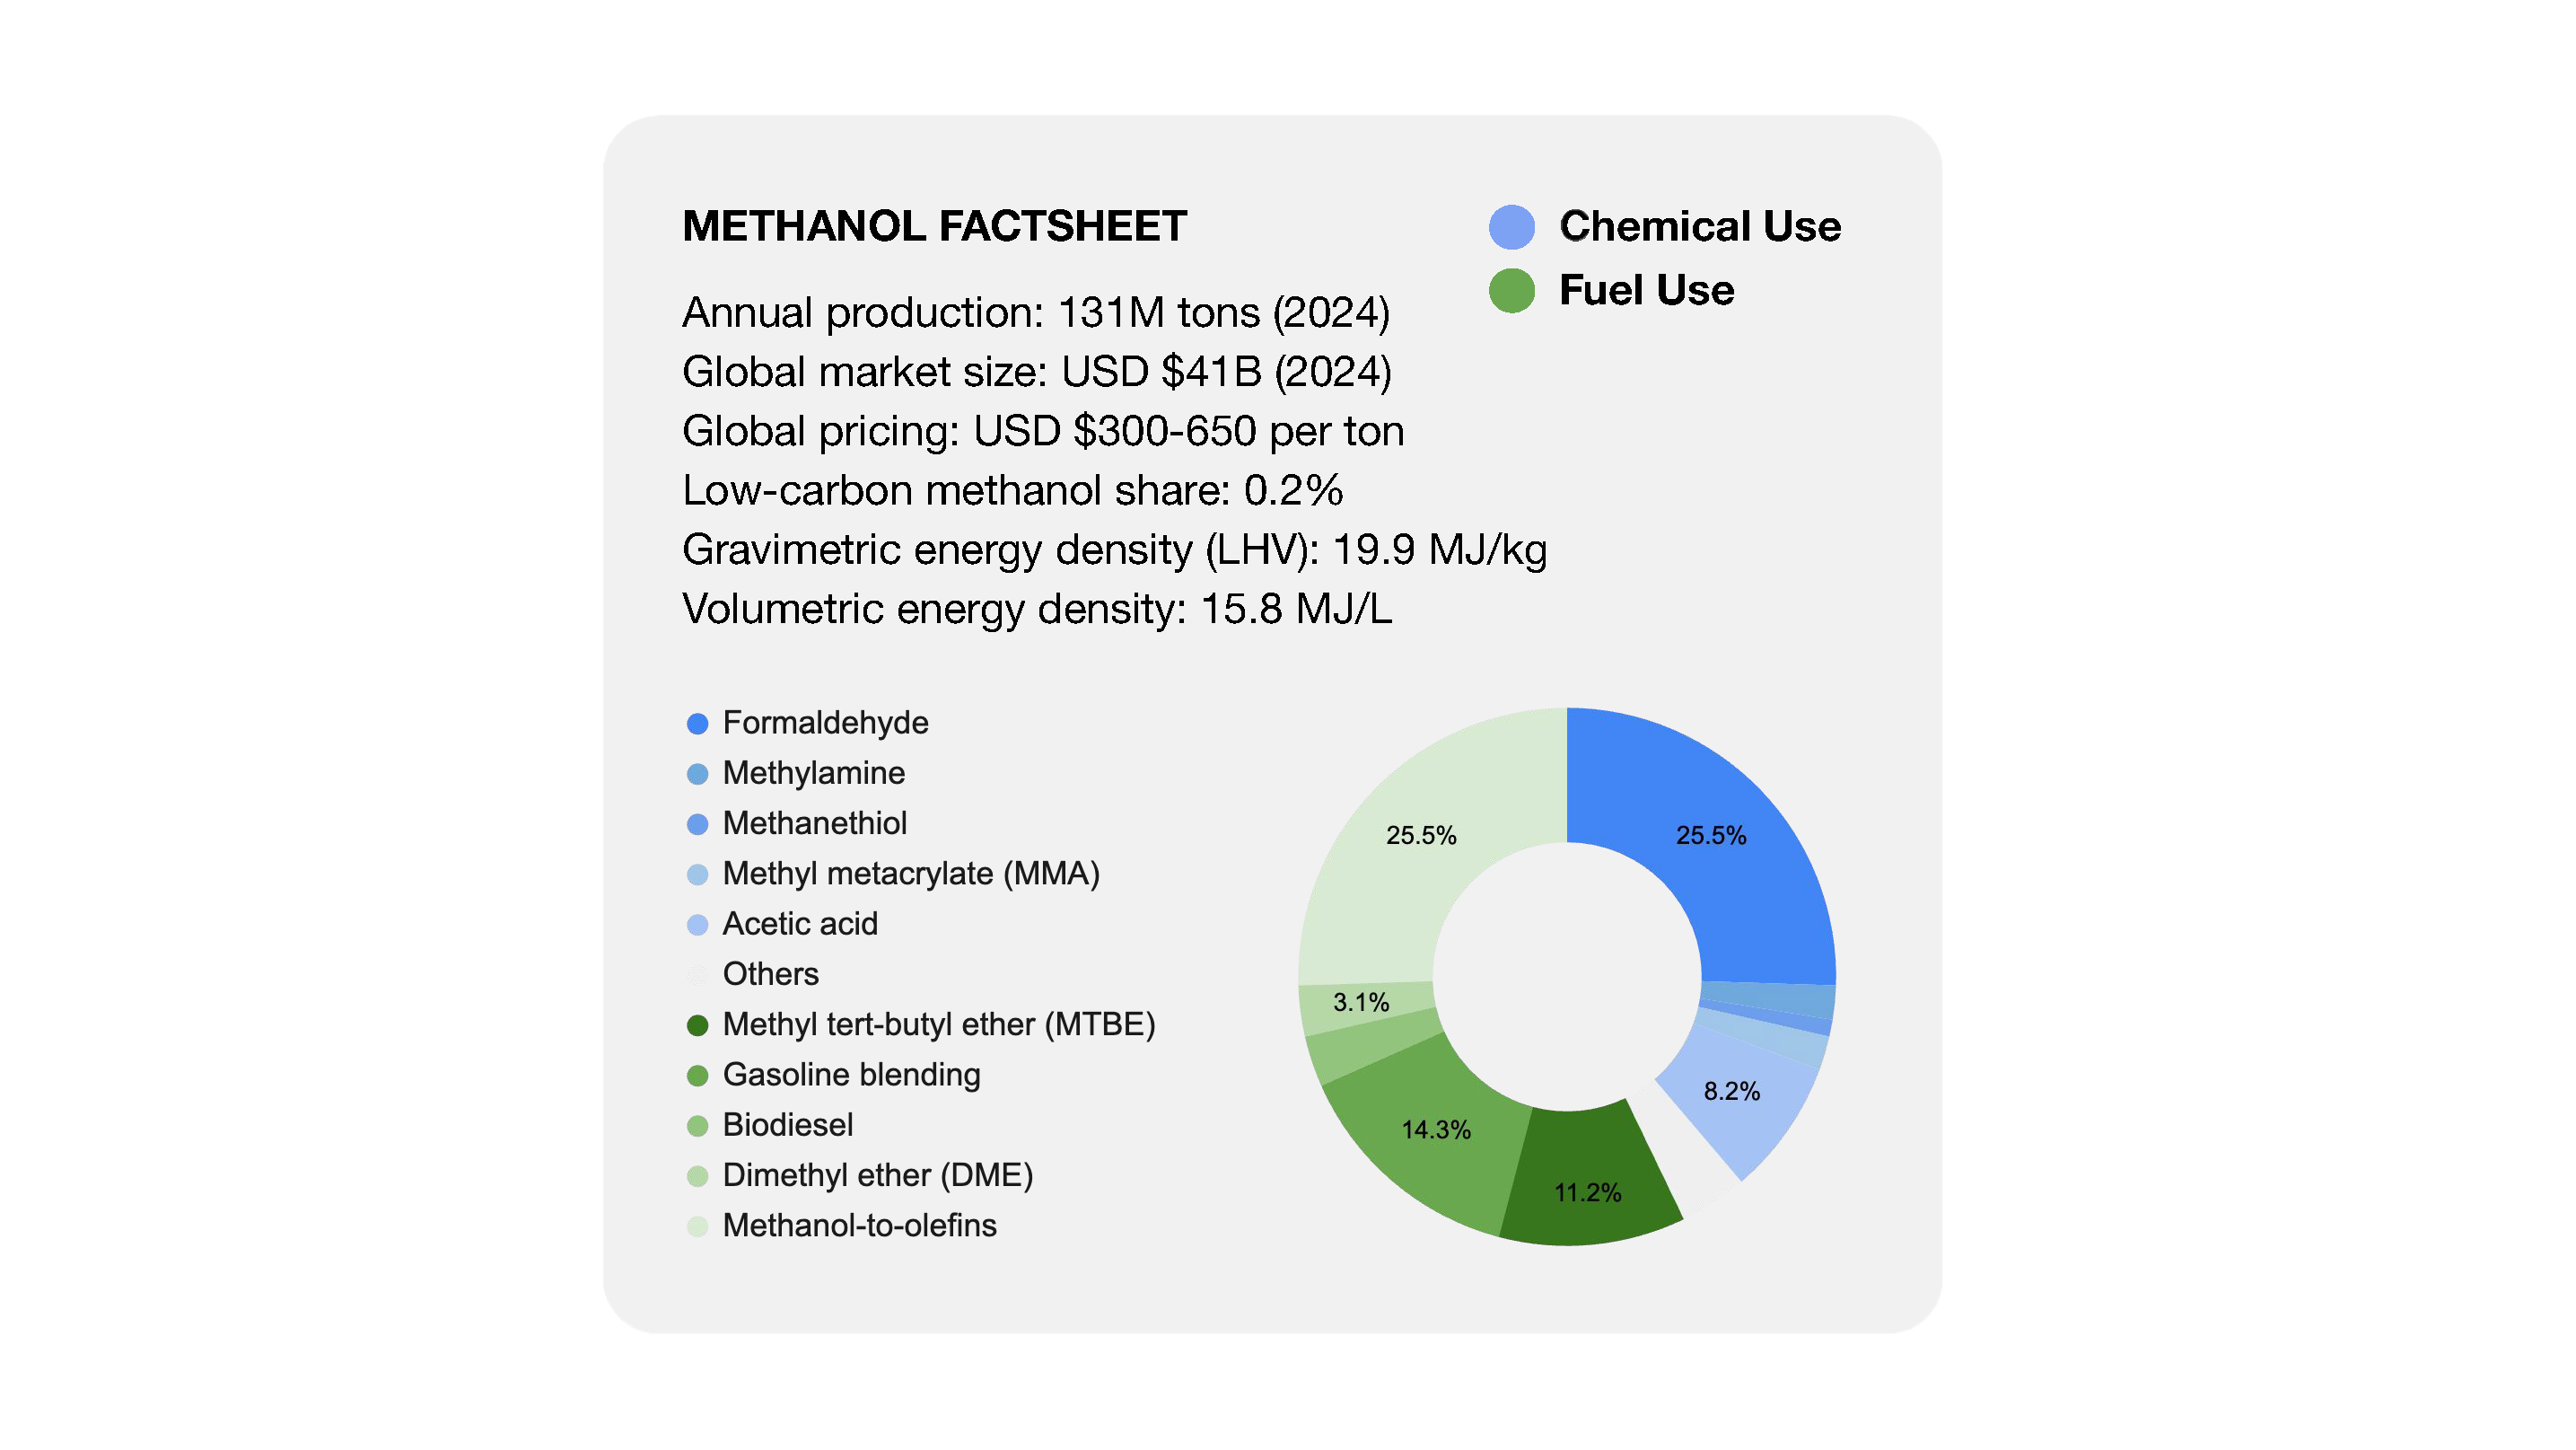
Figure 1: Breakdown of different uses (Source: Methanol Institute)
Methanol uses and market opportunities
Methanol is an important precursor for the chemical industry. Figure 1 gives an overview of the current market. It is a base chemical for formaldehyde (25% of the market), which is used to make resins, adhesives, and plastics. It is also used to produce solvents, fibers, pharmaceuticals, antifreeze, several biofuels, and, more recently, shipping (direct use) and aviation fuel (after some additional refining: methanol-to-jet conversion).
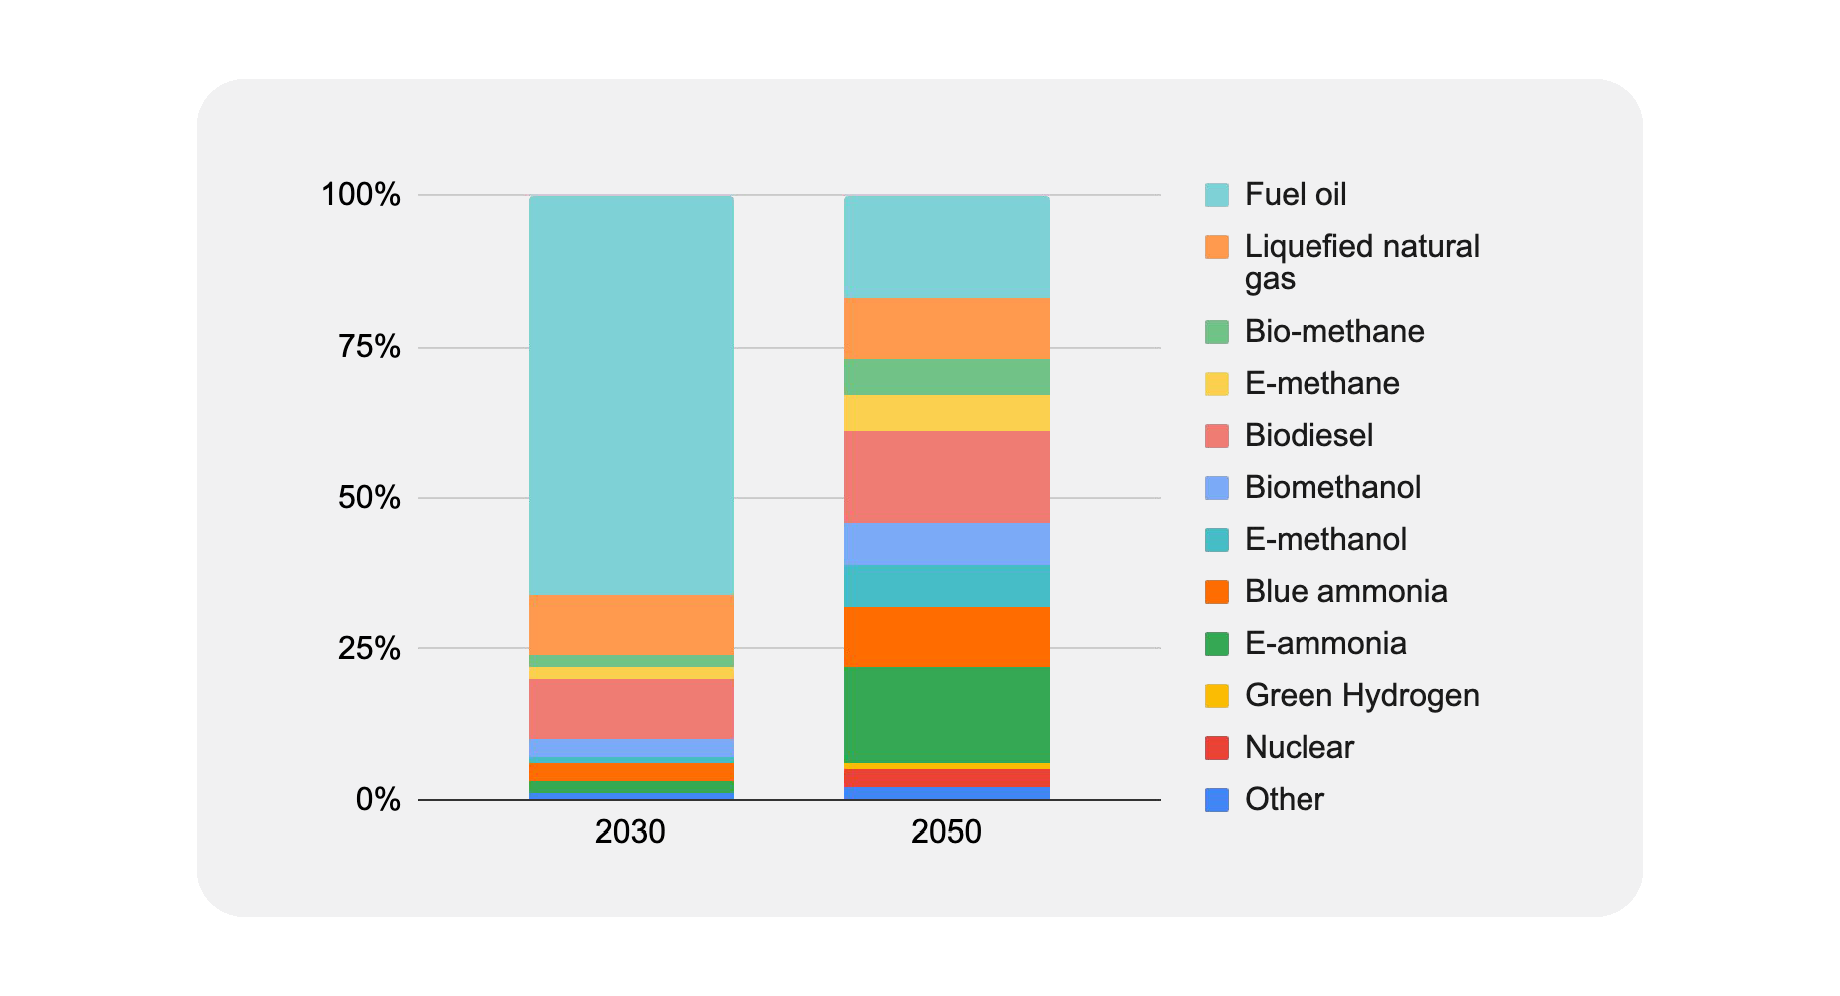
Figure 2: Expected Fuel Distribution by 2030 and 2050 (Source: McKinsey, 2023, n=26)
The rise of methanol uses in shipping
Shipping accounts for 2% of global GHG emissions or 1.1GT of CO2eq annually. The International Maritime Organisation (IMO) wants to reduce emissions by 40% by 2030. 65% of shipping companies have estimated their fuel needs for 2030 and 2050; Figure 2 visualizes the estimates. Biodiesel is at 10% in 2030 and 15% in 2050, ammonia is at 5% in 2030, and 26% in 2050. LNG is at 10% in 2030 and is not expected to grow by 2050. Methanol is expected to be 4% in 2030 and 14% of the mix by 2050. The consensus is that shipping companies will deploy a mix of fuels; 49% expect to adopt four or more fuel families (a fuel family is a group of fuels that a ship could use interchangeably), which means there won’t be ‘one winner takes all,’ but rather a healthy low-carbon mix depending on the ships and geographical availability. They also highlight a few reasons for faster adoption: more availability, lower costs, willingness from customers to pay a green premium, and regulatory change (from high to low importance). Without a doubt, methanol will be an essential part of the mix.

Figure 3: Comparison of different Marine Fuels
There are many reasons why methanol is systematically considered, and Figure 3 compares it with several alternatives. First, space is limited on ships, and saving space is more important than saving weight. For this reason, hydrogen is very unfit as a shipping fuel as it takes up a lot of space per unit of energy (low volumetric density). The same goes for electrification; its gravimetric and volumetric energy densities are very low, meaning you need a lot of space and volume to store the required energy. The advantage of both would be that they are very clean (low risk of soot or particulates in the production process) and have high efficiencies, which makes them great for many applications but not for shipping.
Renewable hydrocarbons such as renewable diesel show the highest volumetric densities at 35GJ/m3. Still, the problems here are the high amount of soot and particulate matter, the efficiency losses, and the energy needed to build those long hydrocarbon chains. LNG scores well as the runner-up in terms of volumetric energy density. Unfortunately, it quickly loses that advantage as it cannot be stored in ambient conditions. The additional insulation needed for storage means that, in reality, it needs just as much space as methanol. Additionally, there is still a risk of methane leakage when storing and moving the fuel. The main benefit is that both these fuels can use existing infrastructure, which makes adoption more feasible.
RELATED EBOOK: Commercial and Industrial Energy Supply Infrastructure — Discover leading startups innovating C&I Energy Supply Infrastructure in this report co-authored by Plug and Play, Future Energy Ventures, and SET Ventures.
Methanol and ammonia are finally very equal in terms of densities. Methanol shows only slightly higher values for both densities. They are also quite similar in corrosiveness (both are high) and conversion efficiencies during production. Ammonia has higher toxicity, though, which also comes with higher infrastructure costs. Regulators such as the IMO are working on guidelines for handling ammonia, and ships must undergo an alternative design procedure. Special training, strict safety protocols, and containment measures for bunkering will be needed. The main use case seems to be deep-sea shipping instead of passenger vessels. Methanol is not acutely toxic but more flammable, and because it’s been used more frequently, handling tends to be easier.
The main advantage of ammonia (NH3) is the lack of carbon atoms, which means it can be made directly from air, there is no need for carbon capture, and no carbon will be emitted; it has the possibility to be fully zero-emission. This is why it’s expected to take a more significant market share in 2050. Methanol can be seen as a bridge between LNG or Renewable Marine Fuel equivalents on the one hand and ammonia on the other hand. It emits less carbon than the traditional fuels. It’s less toxic, less corrosive, and requires fewer infrastructure adjustments in terms of bunkering as well as ship and engine adjustments than ammonia.
Exploring methanol uses in modern aviation
Aviation currently accounts for 2.5% of global emissions but has historically contributed over 4% of global warming. The industry wants to become carbon neutral by 2050, but in 2019, no electric or hydrogen-powered planes were in use yet, and less than 200,000 tons of sustainable aviation fuels were produced. That is less than 0.07% of the 300 million tons used yearly.
To decarbonize aviation, we need to be mindful of the gravimetric density (energy stored per kg of fuel); the lighter the plane, the less fuel is burned, and the more passengers, luggage, or cargo can be transported. Volumetric density also matters since the bigger your fuel tank, the less space is left in the cabin or the bigger your outer shell has to be, which increases drag and fuel consumption. Batteries are impractical for large planes due to their gravimetric energy density being 40 times lower than jet fuel. Since fuel constitutes roughly 20-40% of a plane’s weight, using batteries would prevent the aircraft from taking off. While suitable for smaller planes, hydrogen faces challenges because of its low volumetric density. This requires larger fuel tanks, increasing aerodynamic drag and reducing cargo or passenger space.
Sustainable aviation fuels (SAF) are expected to contribute over 65% of global emission reduction by 2050. SAF must be drop-in, so the end product should always be similar to jet fuel or kerosene. There are, however, different pathways to produce it depending on the feedstock. These also heavily define the carbon footprints, just as with methanol production. There are hydroprocessed esters and fatty acids or HEFA (1) made from vegetable or waste oils, Sugar-to-Jet (2) made from sugar feedstock, Fischer-Tropsch (3), made from syngas (from air and hydrogen or various biomass), Hydrotreatment (4), made from a biocrude intermediary fuel, and Alcohol-to-Jet (5) including Methanol-to-Jet (MtJ), similar to Sugar-to-Jet but made from methanol. HEFA is the most mature process here, while Fischer Tropsch might be the biggest challenger to MtJ. Figure 4 compares the pathways visually by several characteristics.

Figure 4: Comparison of different Sustainable Aviation Fuel Pathways
A first advantage of MtJ is the kerosene selectivity, which tends to be high. It doesn’t need much additional upgrading and is quite feasible to control. Therefore, it yields a high amount of kerosene per unit of fuel produced. A second advantage is the feedstock variety; methanol can be produced from a wide range of feedstocks, including later generations with much smaller carbon intensities (MSW or renewable power). Other processes tend to be more feedstock-specific, such as Sugar-to-Jet or HEFA. Storing the methanol as an intermediary in the process is a third advantage; this can be done at ambient conditions, with no degradation or aging like with biocrudes.
RELATED ARTICLE: Harnessing Earth's Heat: Applications of Geothermal Energy — Learn about the movement toward net-zero targets with sustainable applications of geothermal energy for power generation, heating, and cooling.
The main disadvantages of MtJ are its corrosiveness and toxicity and the lack of available infrastructure. The process is relatively new, with a lower TRL than other pathways, requiring additional infrastructure investment. In terms of costs, methanol’s kerosene-specific energy efficiency is among the highest thanks to its high selectivity and exothermicity. Because of that reason, plant CAPEX also tends to be lower than, e.g., Fischer Tropsch, as there is more opportunity for energy integrations. Still, the complexities of setting up both plants are much higher than those of processes such as HEFA because of process maturity. Furthermore, MtJ benefits from a higher process flexibility, operating at 10% of the design capacity and ramping up quicker than other processes is possible. Fischer Tropsch is getting closer in terms of flexibility with more processes trying to accommodate the interoperability of renewable energy sources.
Therefore, pathway choice depends on feedstock availability, geography, local regulations, existing infrastructure, desired mix of end fuels, and energy source. If the goal is to blend different SAFs or to mix them with existing jet fuel, miscibility (ability to blend) should also be compared.
Other future applications
Other applications include road transport (primarily trucking), rail transport, industrial heat for boilers or furnaces, farm equipment, and grid energy storage. For grid storage, specific direct methanol fuel cells (DMFC) convert methanol back to electricity, with Blue World Technologies being a great startup example.
Pathways for low-carbon methanol production
Adopting more methanol in processes across industries only makes sense if it can be produced with a sufficiently low footprint. In 2023, over 99.8% of methanol production was still grey or brown, meaning it’s not renewable and made from a fossil fuel feedstock: natural gas or coal, respectively. Only the remaining 0.2% was green or blue, which in the case of green methanol means it’s made entirely from renewable feedstocks. In the case of blue methanol, the feedstock is still fossil-based but integrates carbon capture and storage in the process.
Like many low-carbon fuels and hydrogen, the feedstock choice defines the fuel’s color and strongly affects the methanol’s overall carbon intensity (gCO2eq/MJ). The source of the carbon captured can be non-renewable (fossil feedstock such as coal or natural gas) or renewable, in which case it is stored in biomass or waste or captured from the air through a technology-based process such as direct air capture powered by renewable energy.
The expectation is that by 2050, 80% of global production will be green and that green methanol production could reach 500 million tons. The question is how to get there. Figure 5 shows the different pathways.
Figure 5: Low-carbon methanol pathways visualized
E-methanol pathways
Electrochemical pathway
There are four main pathways to produce green methanol: Three for e-methanol and one for bio-methanol. The first path for e-methanol is electrochemical, meaning it’s entirely powered by renewable electricity using an electrolyzer. Using a catalyst, CO2 is reduced to CO and subsequently to other hydrocarbons, including methanol. The pathway has the potential to produce in a single step without high temperatures or pressures. Research is still focused on developing better catalysts (e.g., copper-based), and the main bottleneck appears to be bringing this technology to scale, with no startups operating commercially. Noteworthy examples include Oxylus Energy and Anodyne Chemistries. Oxylus Energy is developing a proprietary catalyst with enhanced selectivity, while Anodyne Chemistries employs engineered enzymes to reduce CO2 emissions.
Alternative catalysis pathway
Under alternative catalysis, a few pathways are being tested that don’t rely on heat or electrochemistry but rather on plasma or photonics. Like the electrochemical pathway, plasma catalysis converts CO2 to methanol in a single step. CO2 is energized using custom catalysts embedded in the electrodes. Innovators are leveraging cold plasma technology for conversion processes at low temperatures (below 150°C) and ambient pressures. Promising startups in the space include Enadyne and Spiralwave. Enadyne employs cold plasma with its patented enaCeramics electrodes, while Spiralwave efficiently transforms flue gases and water directly into methanol with minimal energy usage. On the other hand, Syzygy Plasmonics is an example of a startup using photons to excite the CO2 and convert it in a single step.
Thermochemical pathway
The third and most mature pathway for e-methanol production is thermochemical, which requires high pressures and temperatures to synthesize the methanol. It starts with green hydrogen production from water and renewable electricity. That hydrogen is then combined with captured carbon in a reactor at temperatures around 200–300°C and pressures around 50-100 bar in the presence of a catalyst (often copper-based). Research institutes often focus on developing new catalyst technologies, while startups focus on new (often catalyst-agnostic) reactor types. The goal is to decrease operating conditions while improving methanol’s reaction conversion and selectivity. This is the only e-methanol pathway proven at scale with a handful of plants operating commercially. General Galactic and Carbon One are promising startups in the space that work on more efficient and selective catalysis processes using proprietary modular reactors.
The main pathway for bio-methanol is also thermochemical and starts from biomass or waste. Through gasification or anaerobic digestion, we get syngas or biogas, respectively. Biogas consists largely of methane, which can be further upgraded by steam reforming into syngas, a highly reactive mix of CO and H2. That mix can then be hydrogenated into methanol, similar to the last step of the thermochemical e-methanol process. Promising startups in this field include M2X and Lanzatech. Additionally, innovative efforts are underway to convert waste gases at low temperatures and pressures using microbes in a single step.
Blue methanol pathways
Finally, there are two main pathways to produce blue methanol. The most straightforward solution is steam methane reforming with carbon capture; natural gas reacts with hot steam (temperatures around 700-1000°C) to produce syngas. Flue gases then undergo a CCS treatment that captures the excess CO2, and the remaining mix gets converted to methanol using a catalyst and lower pressures. The second possibility is to follow the thermochemical e-methanol pathway using blue hydrogen instead. Few startups focus their efforts on blue methanol as there is still a risk of methane leakage (methane warms the planet 25 times more than CO2). These pathways are meant for players who have invested in their infrastructure and want to decarbonize existing operations.
Multi-factor comparison of production pathways
In addition to the characteristics of each process mentioned previously, other metrics, such as emission intensities, production costs, and maturity, help decide which technology to invest in or roll out on a larger scale.
Analyzing GHG emission intensities
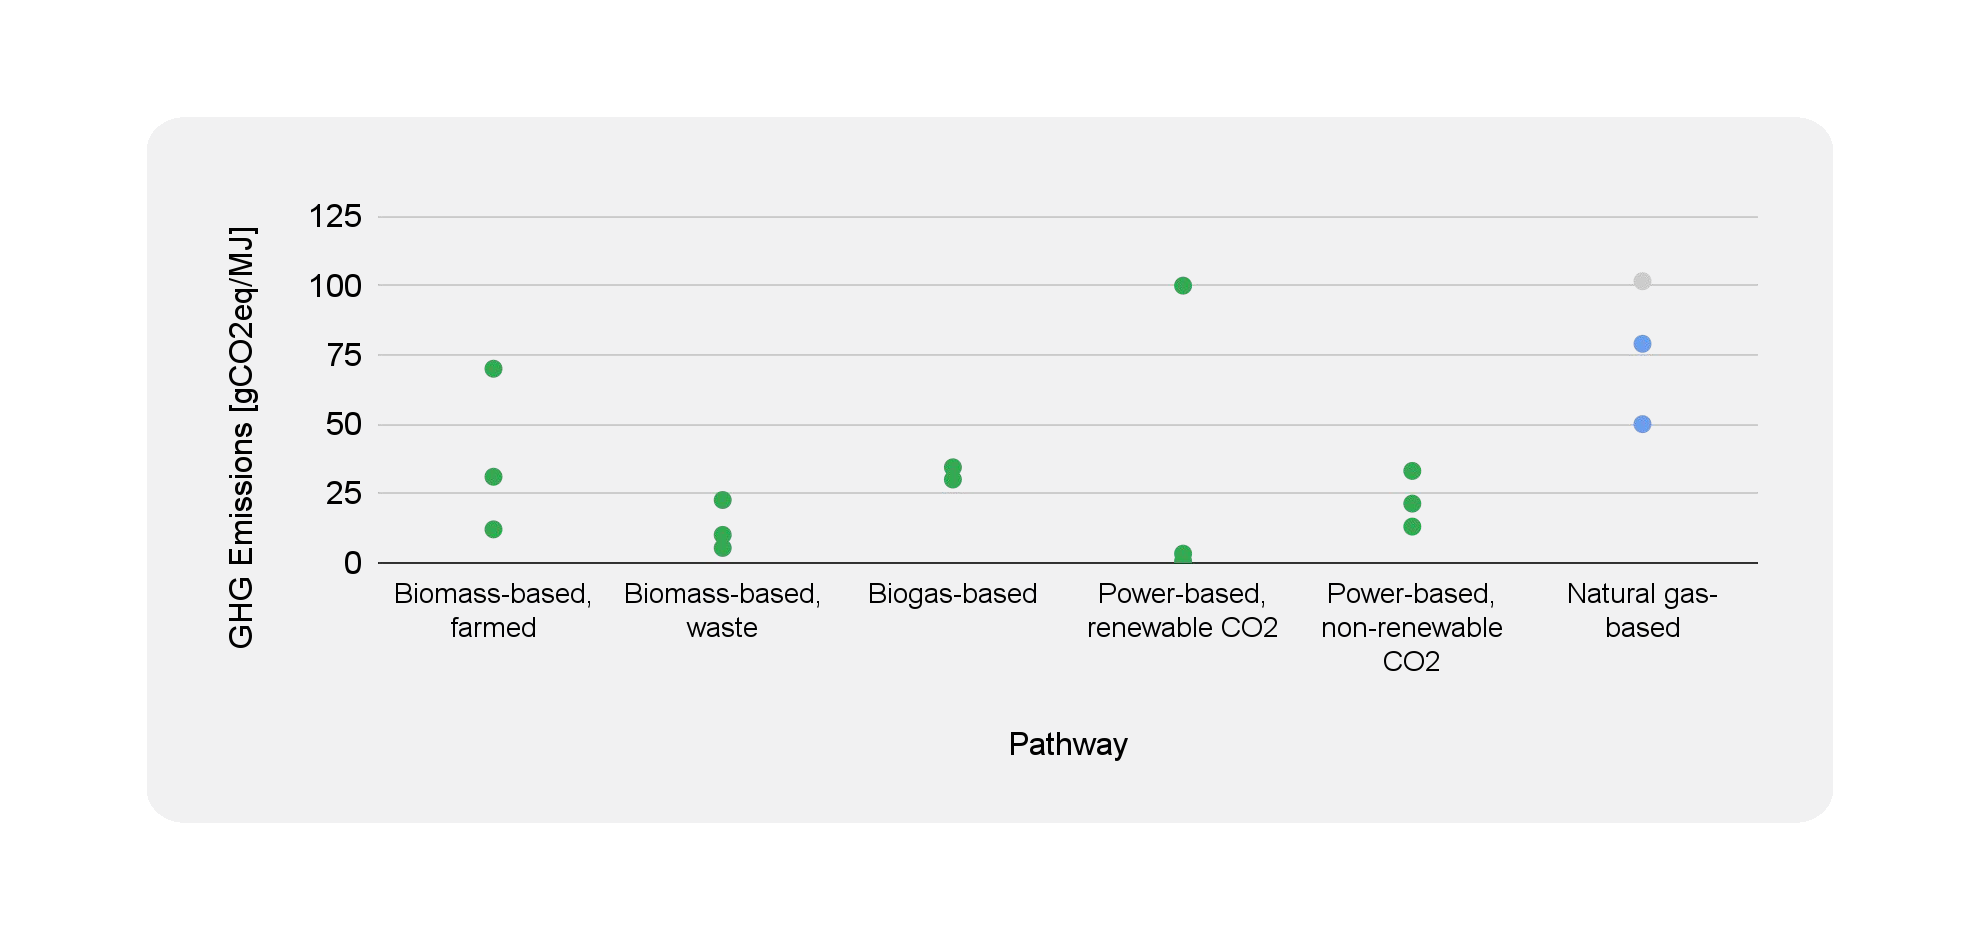
Figure 6 shows each pathway’s GHG emission intensities in g CO2eq/MJ. These numbers result from an LCA or life cycle analysis, where all the emissions from production to distribution (and potentially use) are considered, from GHGs to pollutants such as CO2, methane, NOx, CO, particulates, SOx, etc. Emitters other than CO2 are converted and added as equivalents. The lower this number, the more government support and the less carbon allowances or credits must be used to offset current emissions. Based on values from different experiments, the feedstock has the most significant impact on the intensity, as shown in the Figure below.
E-methanol pathways give the lowest average intensities as long as renewable CO2 and renewable energy are used. If the energy is supplied by the grid, emissions could rise to >100 g CO2eq/MJ in Europe and >150 g CO2eq/MJ in the US. Bio-methanol processes give a more comprehensive range of results. Emissions might be avoided using manure or Municipal Solid Waste (MSW). With additional carbon capture, emissions could even become negative. However, if the biomass is farmed and there is a lot of direct or indirect land use change (dLUC and iLUC), meaning, for example, grasslands are replaced with monoculture or agriculture would be displaced to another location, the intensity could rise again to higher values comparable to blue or grey methanol. In these cases, there is an increase in GHG emissions and a drop in biodiversity.
Grey methanol, on average, has an intensity of 110 g CO2eq/MJ; this can drop slightly (4%) if the emissions are recycled in the process and more significantly (20-40%) if all excess carbon is captured (blue methanol). Brown methanol has the largest footprint (made from coal) with intensities of over 300 g CO2eq/MJ, up to three times higher than grey methanol.
Figure 6: Breakdown of different GHG Intensities (Source: IRENA)
Production costs
A second factor to consider is production cost. Biomethanol is currently cheaper than e-methanol; technologies have been around longer, and feedstocks are less expensive. At scale, a cost drop between 15-30% is expected to be $400-600/ton depending on the feedstock price ($6-15/GJ respectively). CAPEX seems to be the most significant cost factor, and economies of scale and process improvements will be the primary drivers bringing costs down. The biggest challenge in scaling up will be sourcing enough low-cost sustainable feedstock. Cheaper feedstocks such as MSW and residues are limited, and if not locally sourced, transportation could add more costs and emissions to the emission intensity.
The cost savings of e-methanol at scale are expected to be much more significant: 60-75% to ~$450/ton, which is lower on average than bio-methanol at scale. This largely relies on affordable renewable energy, hydrogen production, and carbon capture, with the latter currently being a considerable cost factor. Switching to a mix of carbon sources, such as point-source capture at nearby production facilities, might offer a solution, though it would compete with other carbon capture initiatives. Moreover, transporting carbon is often costly and challenging.
In both cases, feedstock is a major factor. Assuming a 60% feedstock to bio-methanol efficiency (moderate), the cost per ton would go from $500 to $200 if the feedstock cost would go from $15/GJ to $6/GJ. Feedstock should be sufficiently available, which is why the pathway choice will also depend on the plant’s geography. Plants in Africa or Southeast Asia would have a more reliable low-cost feedstock supply than plants in Europe or North America. Areas that benefit from cheap renewables or have a lot of heavy industry in place could produce e-methanol more economically. CAPEX should also be taken into account when comparing pathways and plants. Bio-methanol plants are CAPEX intensive but benefit more from economies of scale.
Technology readiness and startup trends
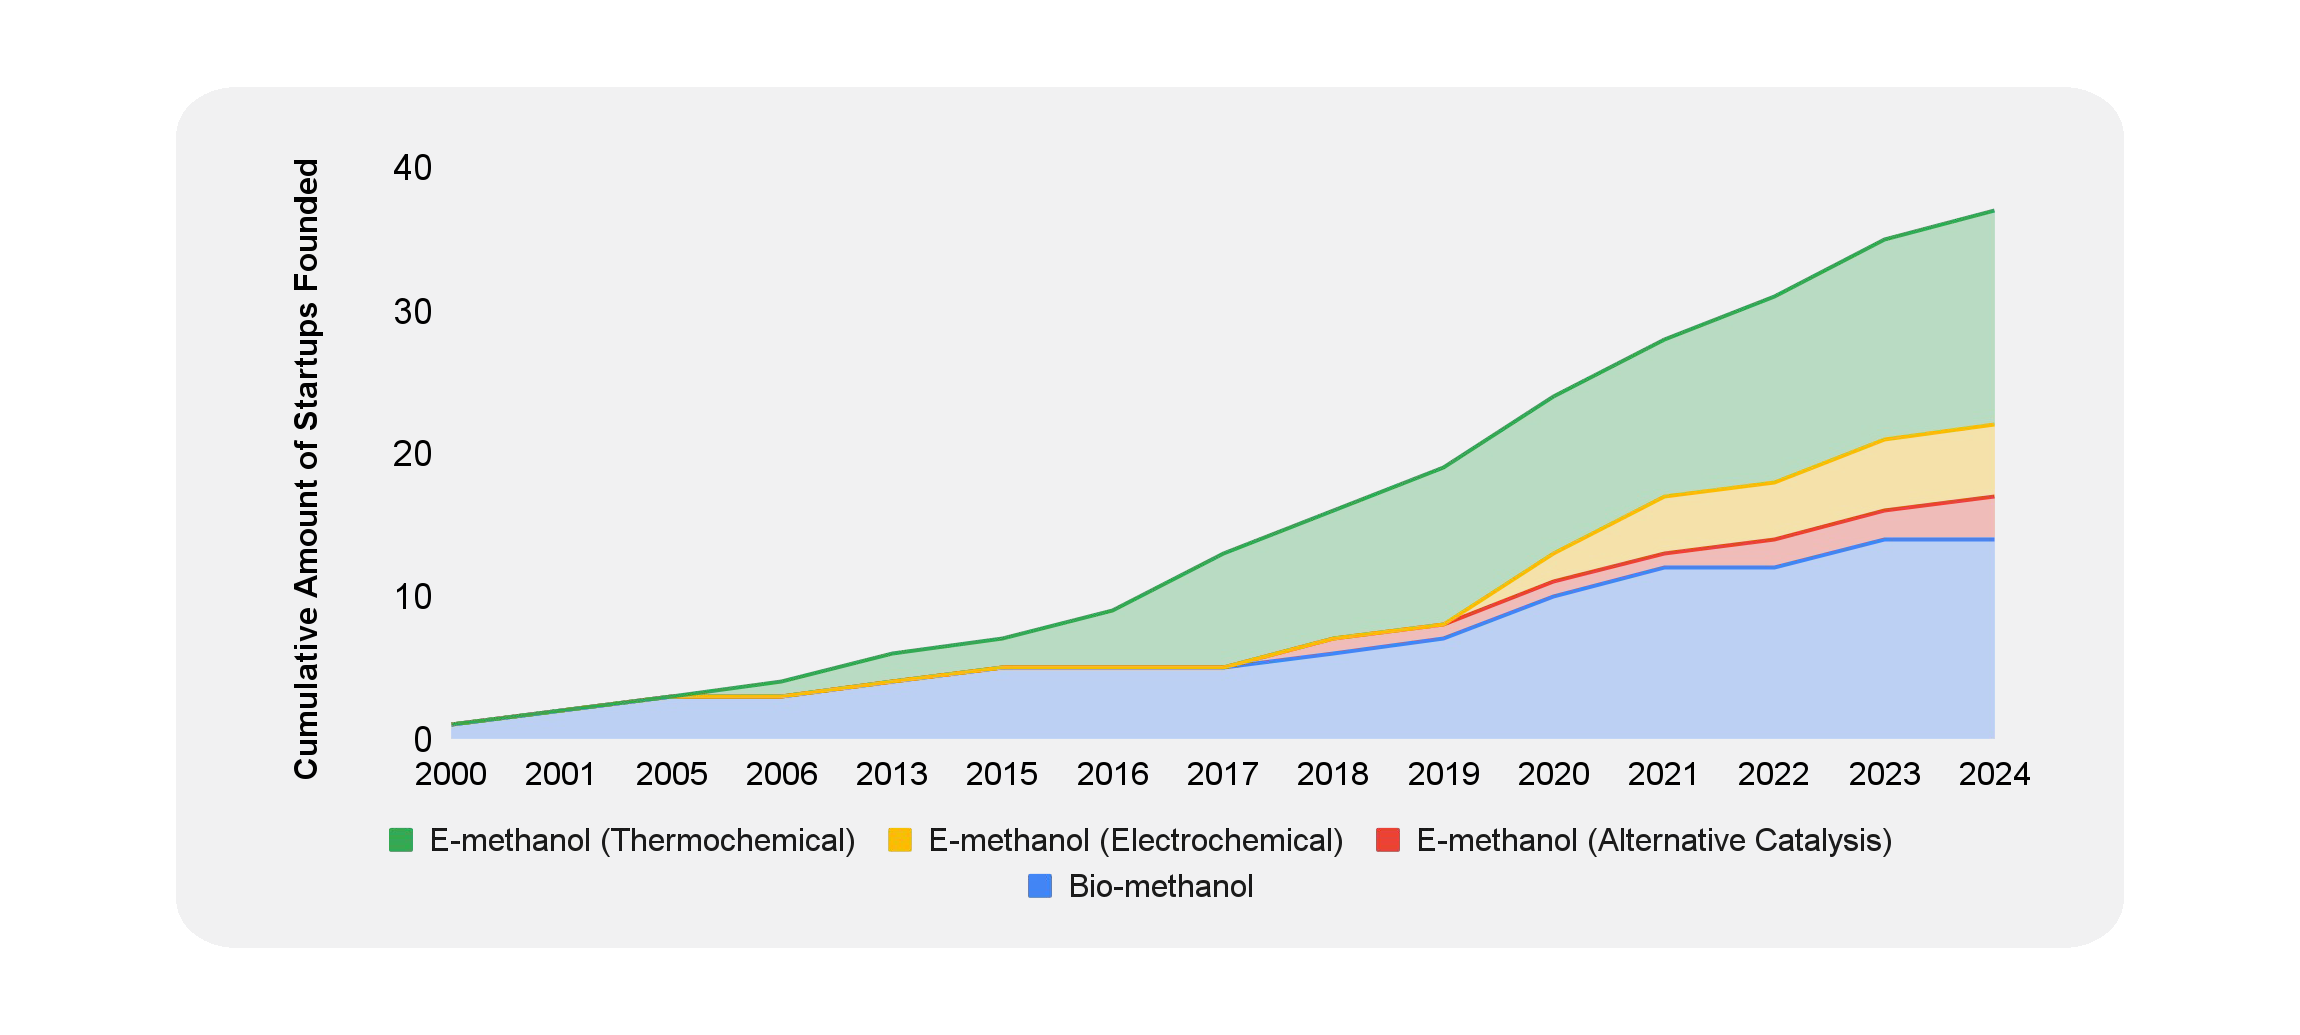
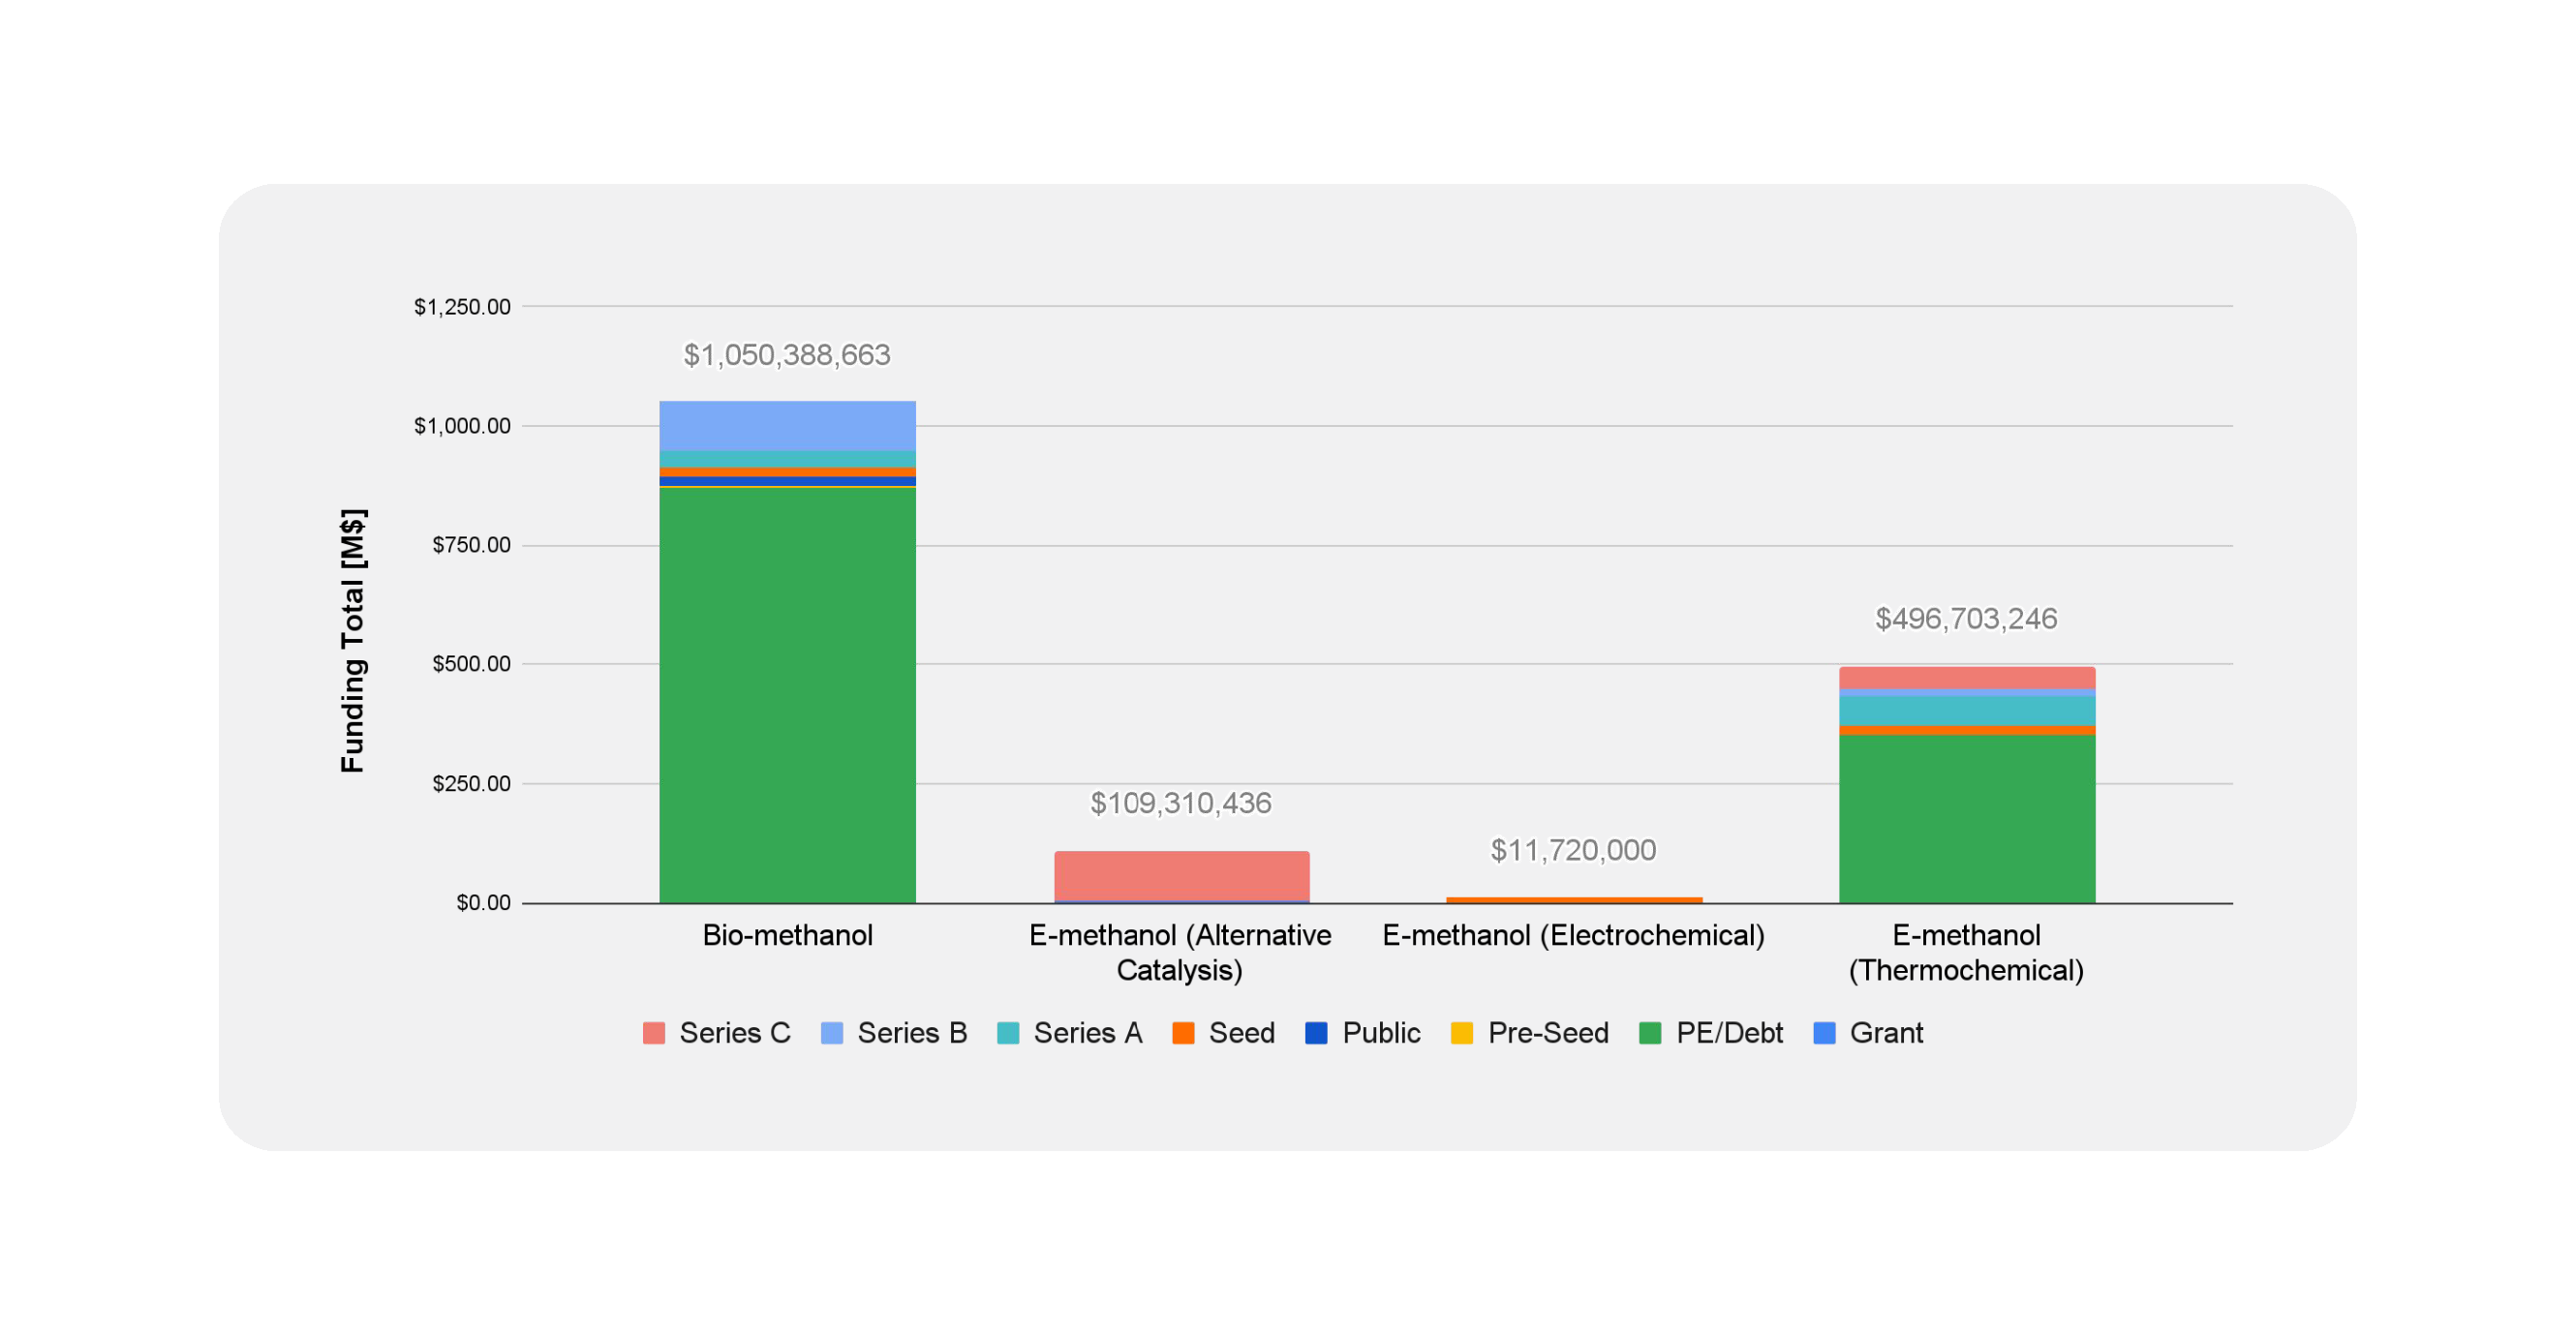
A third factor is the technology readiness (TRL) and the startup activity of each pathway. To assess the startup activity, we can look at the running totals (when startups were founded) or total funding amounts within each funding stage, both visualized in Figures 7 and 8. The surge in e-methanol startups came around 2017, with many new startups researching alternative pathways for the thermochemical approach. The number of bio-methanol startups has stagnated, with limited new ventures in the past five years and funding concentrated in private equity or debt financing.
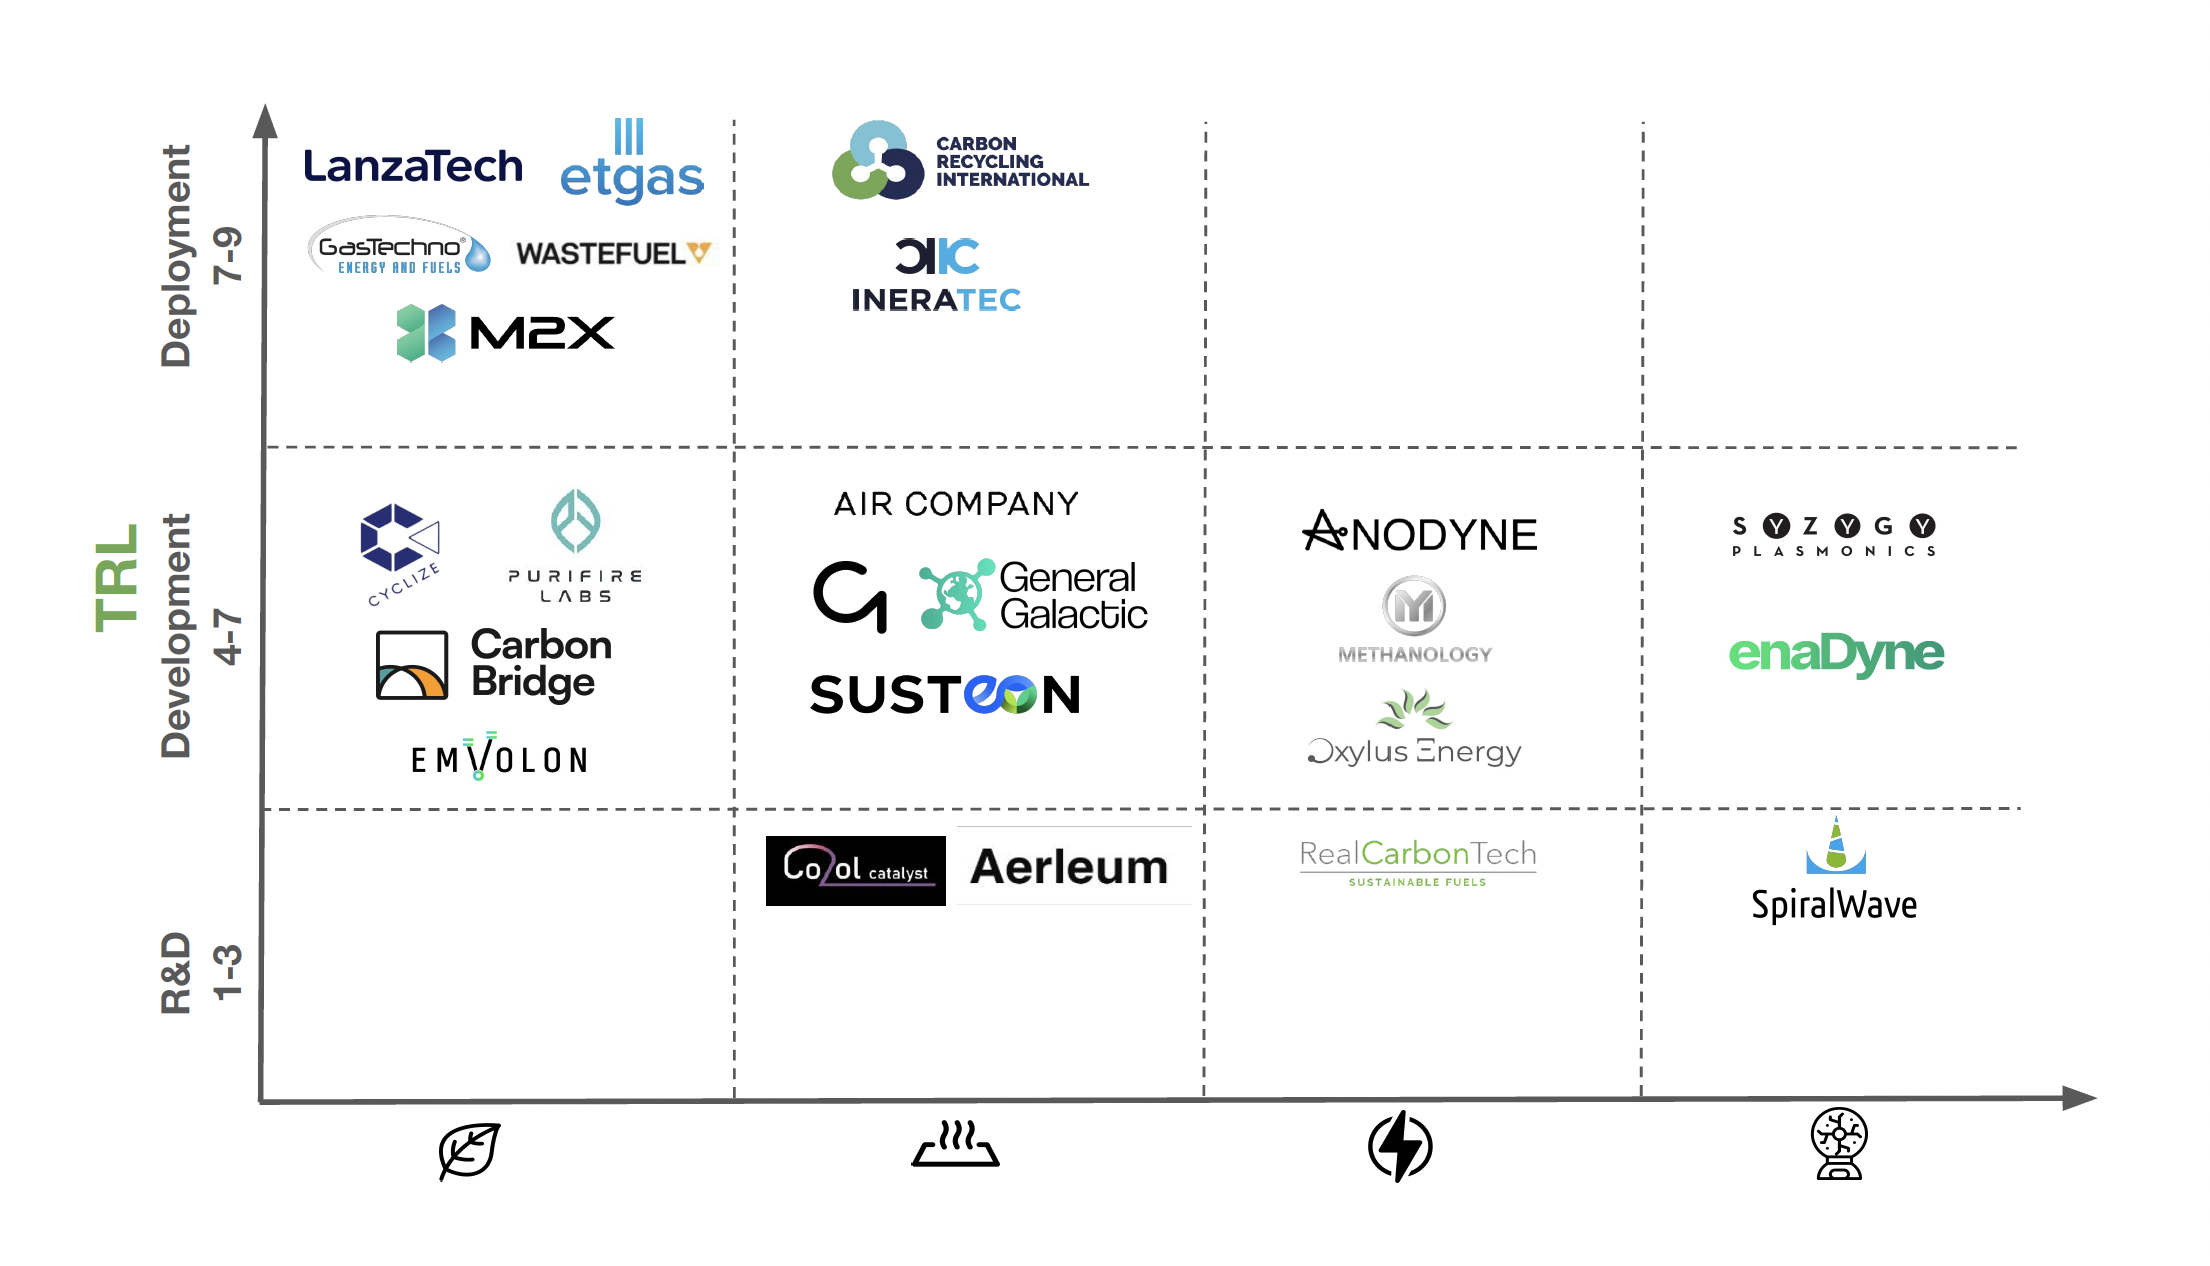
When looking at the TRL levels of various startups (shown in Figure 9), it is clear that bio-methanol startups are generally more mature and have attracted more funding over the years. Thermochemical conversion is the most mature process for e-methanol production, while alternative catalysis and electrochemical solutions are earlier and see less adoption.
Figure 7: Running Totals per Pathway
Figure 8: Funding Totals per Pathway
Figure 9: Startup market map split by TRL level and Pathway
Key considerations for deployment
Renewable methanol presents an excellent opportunity for oil and gas, chemical, and shipping companies. It has a large existing market and will be an essential part of shipping and aviation fuel supply chains for years to come. New pathways are actively being researched and developed, and many of the key value chain components, such as hydrogen or carbon capture, will improve in cost and maturity in the next 5-10 years.
There is still a lot of opportunity for new technologies to reduce costs while maintaining low GHG emission intensities. Premiums are still high, and strong offtake agreements should be in place before investing or deploying. Only some market segments or regions will pay that premium, leading to the termination or suspension of early initiatives like FlagshipONE.Tighter emission regulations, especially in Europe, such as the ETS (Emissions Trading Scheme) and CBAM (Cross Border Adjustment Mechanism), will soon start having their effects on offshoring and will leave few alternative routes to escape decarbonization.